Geography du Jour: Flood Depth/Extent, 3 September 2005
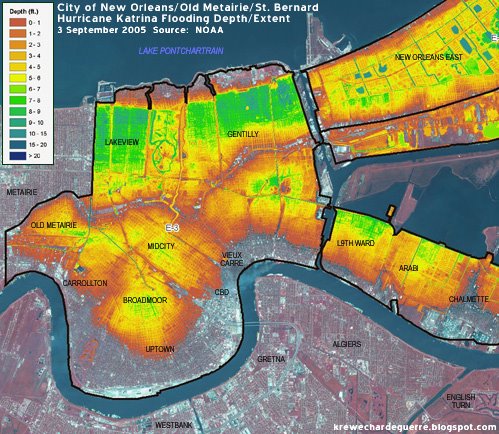
The above map (areas within the black boundary lines) illustrates the peak depth and extent of the KTMB-related flooding in New Orleans, Old Metairie/Old Jefferson, and Upper St. Bernard (Arabi/Chalmette) on 3 September 2005. The data was generated by NOAA applying the modeled levels of the storm surged Lake Pontchartrain/drainage canals and the Mississippi River Gulf Outlet (MRGO) and overlaying it with a LIDAR-generated elevation model. The differences between the ground elevation and the peak water level is the depth value thematically displayed on the map. The areas where the satellite photography is visible are the locations not inundated becasue of the floodwall/levee failures. The water depth progression ranges go from red (the shallowest waters) to orange to yellow to green to blue (the deepest waters).
posted by Seymour D. Fair @ 12:15 PM
0 comments
![]()
![]()

0 Comments:
Post a Comment
<< Home