Map du Jour: City of New Orleans Repetitive Loss Claims by Census Tract
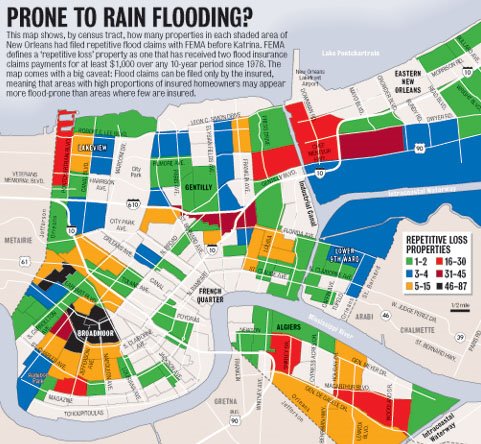
The above map appears on today's front page of the Times-Picayune with this accompanying story. As the disclaimer on the map states, this map can be misleading because just because an area has more claims doesn't necessarily mean its more flood prone. Also keep in mind this data takes into account only rain-related flooding (such as the May 1995 flood) and does not include any claims derived from the MANMADE flooding within the City of New Orleans due to floodwall failure post-KTMB. Not surprisingly Broadmoor/Fountainbleu does have the most claims given it's geographic location and economics. Here's what some friends did to their house in Broadmoor with a FEMA grant following repetitive flooding in 1995 and 1998. Their area did of course flood post-KTMB, but the main living space of the house avoided the floodwaters. Unfortunately, the roof sustained damage and rainwater penetrated the raised portion of the house anyway.
FYI: The flood event that garnered the most paid claims in the history of FEMA by the National Flood Insurance Program was the infamous 9 May 1995 Flood at 31, 264 "paid losses." That event held the dubious honor until August 2005 as 141,786 paid losses have been documented from KTMB-related flooding. The list of significant flood events compiled by the FEMA NFIP can be seen here.
posted by Seymour D. Fair @ 9:56 PM
0 comments
![]()
![]()

0 Comments:
Post a Comment
<< Home